 |
 |
|
|
La più bella sei tu
Most beautiful bottle
|
Una giuria speciale (le maestranze) ha nominato le bottiglie più belle di Saint-Gobain Vetri.
A special jury (the employees) has chosen the Saint Gobain Vetri’s most beautiful bottles.
|
|
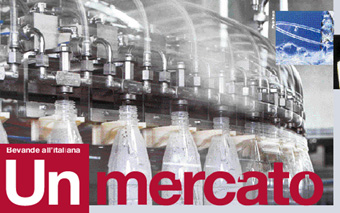
Un mercato in attivo
A market showing profit
|
Macchine per enologia e imbottigliamento: bene con prospettive di crescita ulteriore. Consumi mondiali di bevande.
Winemaking and bottling machine: good with prospects of further growth. Worldwide beverages consumption.
|
|
Scenari di packaging
Packaging scenarios
|
La multimedialità offre strumenti capaci di migliorare la qualità delle ricerche di mercato, e Scenari se ne fa interprete.
Multimedia offers some valid tools that help one improve the quality of market research, and Scenari interprets these.
|
|
Ideas & Trends
|
|
Ready to use
|
|
|


|
|
DATI E FATTI Saldo commerciale attivo per le macchine per enologia e imbottigliamento, con prospettive di crescita ulteriore. In dettaglio, l’andamento di alcuni settori merceologici del beverage. Ribadito su più fronti il ruolo di riferimento a livello mondiale dell’industria nazionale.
A cura della Redazione
La bilancia commerciale del comparto macchine per enologia e imbottigliamento registra un altro segno positivo, confermando così, anche per il triennio 2002/2004, una tendenza ormai in atto da diversi anni. I dati più recenti (2004) parlano infatti di una crescita costante: l’interscambio di macchine per l’enologia e l’imbottigliamento, tra import ed export, ha superato i 2.259,909 milioni di euro.
In particolare, nel 2004, le importazioni hanno toccato i 519,106 milioni di euro a fronte di esportazioni per 1.740,802 milioni di euro, per cui la bilancia commerciale con l’estero si è chiusa nel 2004 con un forte saldo attivo: oltre 1.221,696 milioni di euro.
L’industria nazionale di settore guarda dunque con serenità al futuro, anche in considerazione del fatto che i mercati esteri sono diventati più accessibili, e che nuovi Paesi (dove si sono sviluppate nuove realtà produttive nel comparto dell’imbottigliamento delle bevande) sono interessati a importare (tabella 1).
Export: dove? - Le opportunità commerciali sono dunque cresciute praticamente ovunque (Est Europa, Sudamerica, Asia, Africa, Medio-Oriente). Secondo rilevazioni effettuate sul 2004, i primi venti mercati mondiali per l’export delle macchine enologiche italiane sono in ordine: Francia, Spagna, Stati Uniti, Iran, Australia, Portogallo, Cina, Romania, Ucraina, Grecia, Moldavia, Cile, Russia, Repubblica Sudafricana, Ungheria, Argentina, Bulgaria, Germania, Turchia e Canada (in decisa crescita risultano le esportazioni verso i Paesi dell’ex Unione Sovietica, asiatici e del Nuovo Mondo, ma si rileva una forte ripresa all’interno dell’Unione Europea).
Per quanto concerne invece le macchine legate al processo dell’imbottigliamento nelle diverse fasi, e comprese le bevande diverse dal vino, le prime 20 nazioni interessate dal nostro export sono: Francia, Spagna, Stati Uniti, Germania, Regno Unito, Russia, Cina, Paesi Bassi, Messico, Ucraina, Belgio, Australia, Polonia, Svizzera, Portogallo, Romania, Austria, Brasile, India e Giappone.
Il settore delle macchine per riempire, chiudere, etichettare e incapsulare le bevande costituisce da solo la metà del flusso di esportazione (per un valore di 842.270,74 milioni di euro contro 140.176,54 milioni di importazioni).
|
 |
Italian beverage
A market showing profit
FACTS AND FIGURES - Commercial balance at a profit for the winemaking and bottling machines, with prospects of further growth. In detail, the run of some merchandise sectors. Confirmed on several fronts the lead role played at world level by the Italian market.
By our editorial staff
The commercial balance of the winemaking and bottling has put in another positive showing, thus confirming, also for the three years 2002/2004, a trend that has now been underway for several years now. The most recent figures (2004) in fact speak of a constant growth: trade in winemaking and bottling machines, including both import and export, has passed the 2,259.909 million Euro mark.
In particular in 2004, imports touched on 519.106 million Euros against exports of 1,740.802 million Euros, meaning that the balance of trade with abroad for 2004 showed a credit of 1,221.696 million Euros.
Hence the Italian industry in the sector happily looks to the future, also in consideration of the fact that foreign markets have become more accessible, and that new countries (where new concerns have sprung up in the beverage bottling segment) are interested in importing (table 1).
Export: where? - Hence the commercial opportunities have grown practically everywhere (eastern Europe, South America, Asia, Africa, Middle East).
According to studies made in 2004, the first twenty world markets for the export of Italian winemaking machines are in the order: France, Spain, US, Iran, Australia, Portugal, China, Rumania, Ukraine, Greece, Moldavia, Chile, Russia, South African Republic, Hungary, Argentina, Bulgaria, Germany, Turkey and Canada (exports towards ex Soviet countries, Asia and the new world are up considerably, but there is also a strong recovery within the European Union).
As far as the machines associated with the process of bottling in the various phases are concerned, this including beverages other than wine, the first 20 countries involved with Italian products are: France, Spain, US, Germany, UK, Russia, China, Low Countries, Mexico, Ukraine, Belgium, Australia, Poland, Switzerland, Portugal, Rumania, Austria, Brazil, India and Japan.
The sector of the filling, closing, labeling and capsuling machines on its own makes up half of the flow of exports (to a value of 842,270.74 million Euros against the 140,176.54 millions of imports).
|
|
|
|
Tutto da bere…
21 edizioni all’attivo, 750 aziende da 23 Paesi, un’area espositiva di 75.000 metri quadrati, oltre 50 mila visitatori attesi. Questi i numeri 2005 del Simei (22-26 novembre, Fiera di Milano - Portello) ovvero della più completa esposizione del mondo, che presenta in un’unica soluzione tutti i tipi di macchine, prodotti e attrezzature per l’enologia, nonché macchine e impianti per la produzione, l’imbottigliamento e il confezionamento delle bevande (vino, birra, liquori, acquaviti, aceto, succhi, alcol, olio, acque minerali, bevande gassate).
Ampia dunque la merceologia in fiera: grandi, medi e piccoli impianti per l’imbottigliamento, macchinari per la lavorazione delle uve e i diversi trattamenti del vino, materiali per il confezionamento e l’imballaggio dei liquidi imbottigliati, attrezzature interne aziendali, di recipienti di ogni genere e dimensione, di coadiuvanti tecnologici, e così via, nella versione tecnicamente più moderna e più vantaggiosa dal punto di vista economico.
In pratica, si tratta di strumenti adatti a migliorare l’organizzazione tecnica e la produttività di aziende coinvolte in un mercato che gode, numeri alla mano, di buona salute. Il valore dei macchinari esposti quest’anno dovrebbe aggirarsi, orientativamente, intorno ai 100 milioni di euro; ricordiamo anche che gli affari conclusi nel corso della passata edizione (2003) di Simei hanno sfiorato i 50 milioni di euro.
|
|
Drinkables all around…
21 editions to their credits, 750 companies from 23 Countries, and exhibition space covering 75,000 squared metres, over 50,000 visitors expected. These the 2005 figures for Simei (22nd -26th November, Milan trade fair - Portello) or rather the most complete exhibition the world over, that presents all types of machines in a single solution, products and equipment for winemaking, as well as machines and equipment for production, bottling and packaging beverages (wine, beer, spirits, vinegar, juices, alcohol, oil, mineral water, carbonated beverages etc).
Hence broad a broad range of products at the fair: large, medium and small systems for bottling, machines of processing grapes and for the various wine treatments, materials for wrapping and packaging bottle liquids, in-house company equipment, receptacles of all kinds and sizes, technological aids and so forth, in the technically most modern and most advantageous version from the economic point of view.
Practically speaking, they are tools suited to improve the technical and production organization of the companies involved in a market that, figures to hand, is enjoying great health. The value of the machines on show this year should be something like 100 millions of Euros; we also recall that the business concluded during the last edition (2003) of Simei touched on 50 million Euros.
|
|
|
|
|
|
|
|
Focus su acqua, birra, bibite, succhi e vino
I dati di consumo riportati sommano le informazioni provenienti dalle associazioni di categoria, dalle elaborazioni effettuate da Beverfood, oltre che dalle sintesi degli Uffici Comunicazione di Simei e Vinitaly.
Produzione di acqua minerale: l’Italia ai vertici
La produzione e il consumo mondiale di acque confezionate si attestano, con riferimento al 2003, intorno ai 140 miliardi di litri annui, pari a un consumo pro-capite di circa 23 litri annui. Nell’ambito delle “bevande analcoliche fredde” le acque confezionate registrano i tassi di espansione più marcati (9% all’anno). Le due aree continentali a maggior consumo pro-capite sono l’Europa Occidentale e il Nord America, che nell’insieme, pur rappresentando solo l’11% della popolazione mondiale, assorbono circa la metà del consumo mondiale di acque confezionate.
Notizie dall’Europa - Secondo le valutazioni di Canadean e dell’Associazione Europea dei Produttori (EFBW), nel 2003, i consumi di acqua confezionata nei Paesi dell’Europa Occidentale sono stimabili complessivamente intorno ai 42 miliardi di litri, con consumi pro-capite di 106 litri annui. Il continente europeo è ricco di fonti naturali e, quindi, la quasi totalità dei consumi di acqua imbottigliata è soddisfatta da acque naturali (minerali e di sorgente), mentre nel resto del mondo tendono a prevalere le acque trattate (purificate ed eventualmente affinate).
• In quasi tutti i paesi europei prevalgono i consumi di acqua liscia, tranne che sui mercati di lingua tedesca (Germania, Austria e Svizzera) dove prevalgono ancora le acque frizzanti ma dove, tuttavia, il consumo delle acque lisce sta crescendo più rapidamente.
I consumi pro capite di acque minerali nei vari paesi europei sono ancora molto disomogenei.
• Il fattore climatico ha un’influenza decisiva sul livello dei consumi, anche se anche paesi “freddi” (Belgio, Germania, Svizzera) sono forti consumatori di acque minerali. D’altronde, la tradizione termalistica ha creato le premesse culturali per lo sviluppo del consumo di acque minerali.
• Il boom del mercato è stato indubbiamente favorito da politiche di prezzi popolari; nei paesi con bassi consumi pro-capite è stata invece privilegiata una concezione elitaria del mercato, con l’offerta di acque minerali posizionate come bevande premium, talvolta a livelli addirittura superiori alle bibite gassate.
La realtà italiana - Con 12 miliardi di litri prodotti nel 2003 e oltre 11 miliardi consumati nello stesso anno, il mercato nazionale vanta il primato in ambito europeo. In Italia, l’acqua da bere confezionata è quasi totalmente acqua minerale, grazie al ricco patrimonio di fonti naturali. E anche se l’estate 2004 non ha più avuto la “bolla termica” dell’anno precedente e i consumi si sono assestati su valori normali, sono pur sempre risultati in crescita rispetto all’esercizio 2002.
• I tassi di sviluppo del mercato italiano appaiono più bassi di quelli medi europei, in considerazione degli elevati consumi. Nel prossimo quinquennio appare ragionevole aspettarsi una crescita media contenuta intorno al 2% l’anno.
• Il consumo pro-capite di acque minerali è di 180 litri annui, che si porta a 183 litri se si includono anche le acque di sorgente. Il dato del consumo pro-capite è il più elevato al mondo. I valori sono più alti nelle regioni dell’Italia Settentrionale, mentre al Sud e nelle Isole i consumi pro-capite sono sotto la media, ma mostrano maggiori potenzialità di sviluppo.
• Il giro d’affari dei produttori italiani di acqua minerale è stimabile intorno ai 2.100 milioni di euro (riferimento 2004), mentre il valore al consumo (spesa degli italiani) è valutabile in almeno 3.000 milioni di euro. Rapportando i dati a valore con i dati a quantità si evidenziano dei prezzi medi (alla produzione e al consumo) molto bassi, probabilmente i più bassi a livello europeo. Questa politica di prezzi popolari ha certamente favorito lo sviluppo dei consumi nel nostro paese e, tuttavia, pone problemi di redditività.
• Anche l’innovazione dell’imballaggio gioca un ruolo propulsivo in questo ambito. Si è notevolmente ridotto, nel corso degli anni, il “peso” delle bottiglie di vetro (21% del totale volumi) che, oggi, sono presenti quasi esclusivamente nei canali Horeca e del “porta a porta”, dove vige ancora la pratica del “vuoto a rendere”.
• Per quanto riguarda i contenitori di plastica (79% del totale volumi), le bottiglie di PET fanno ormai la parte del leone, mentre le bottiglie di PVC sono scomparse dalla circolazione. Le bottiglie di PET da 1,5 e 2 litri sono le più vendute per il consumo familiare.
• La bottiglia single serve di PET da 0,5 litri, diventato ormai il formato esclusivo per alcuni canali (ristorazione veloce, vending, chioschi ecc.) sta contribuendo in maniera decisiva all’attuale sviluppo dei consumi fuori casa. Formati minori (0,25 e 0,33 litri) sono più specificamente destinati ai locali dell’Horeca, che intendono superare la vecchia e discutibile pratica del servizio dell’acqua minerale in bicchiere.
• La ripartizione dei consumi delle acque minerali italiane può essere stimata come segue: 76% in ambito domestico (8 miliardi di litri alimentati dai punti di vendita della GDO) e 24% fuori casa (2,5 miliardi di litri somministrati tramite Horeca, catering collettivo vending, …).
• I consumi domestici di acqua minerale sono alimentati anche dai numerosissimi punti di vendita del dettaglio alimentare tradizionale e dal sistema delle vendite “porta a porta”. La competizione di prezzo è particolarmente stressata, dove si è consolidata una vera e propria strutturazione dell’offerta in differenti fasce di prezzo, che viene però sistematicamente rimescolata dal gioco delle offerte promozionali.
• Secondo le valutazioni di Mineracqua, il sistema produttivo delle acque confezionate italiane risulta così strutturato:
- 170 fonti attive;
- circa 300 marche di acque confezionate;
- 7.500 dipendenti diretti;
- 32.500 dipendenti indiretti.
• Il grado di concentrazione del mercato è discreto ma meno accentuato rispetto al mercato delle bibite (tabella 2). Secondo le valutazioni Beverfood i primi 4 gruppi produttivi (Nestlè/ Sanpellegrino, San Benedetto, Congedi/Uliveto/Rocchetta e Ferrarelle) assorbono circa il 58% del totale mercato a quantità. I primi 10 gruppi (i quattro precedenti, più Spumador, Norda, Sant’Anna, Sangemini, Lete/Prata e Gaudianello) rappresentano circa l’80% del totale di mercato. I produttori leader faticano a mantenere le loro quote, incalzate da un nutrito gruppo di medie aziende molto combattive, che dopo aver conquistato posizioni di leadership a livello regionale, stanno tentando di pervenire a una distribuzione nazionale.
(fonte: Beverfood)
Birra: giù’ Europa e Nord America, su Asia ed Est Europeo
Il quadro competitivo mondiale è caratterizzato da un intenso processo di concentrazione. Negli ultimi anni produzione e consumo di birra sono cresciuti con tassi intorno al 2-3% annuo.
Il primato continentale dei consumi pro-capite spetta all’Oceania (86 litri) che, tuttavia, considerato il numero di abitanti (solo 25 milioni) rappresenta un’entità modesta sullo scacchiere internazionale. L’Asia, con circa il 60% della popolazione mondiale e appena 11 litri di consumo pro-capite, rappresenta il continente più promettente in termini di sviluppo prospettico, mentre l’Africa rimane per il momento in posizione marginale (4,5% del totale mondiale).
I primi 10 paesi produttori, assorbono oltre due terzi della produzione globale di birra. Al vertice di questa classifica si è da poco insediata la Cina che, con una produzione di 254 milioni di hl, ha ormai superato, gli USA (232 milioni di hl).
Notizie dall’Europa - I gruppi europei Heineken e Carlsberg si collocano al quarto e al quinto posto della graduatoria mondiale dei produttori.
• Secondo le valutazioni dell’Associazione Europea dei Birrai (The Brewers of Europe), nel 2003 l’Europa Occidentale ha prodotto 319 milioni di hl di birra e ne ha consumato un po’ meno (298 milioni di hl), grazie al fatto che la bilancia commerciale evidenzia un saldo netto di oltre 20 milioni di hl. Il settore viene considerato in piena maturazione, con consumi in lenta diminuzione, mentre la produzione si sforza di mantenere i volumi, grazie all’export.
• Il 2004 ha registrato un’ulteriore perdita dei consumi dell’1,5% in volume. Il consumo pro-capite è stimato intorno ai 75 litri annui; dieci anni fa era di oltre 80 litri. Rispetto alle altre categorie del bere freddo, le birre si collocano al terzo posto nella classifica dei consumi europei, dietro alle acque confezionate e alle bibite (piatte + gassate).
• La birra entra in competizione di consumo soprattutto con le altre bevande alcoliche, vino in primis; non a caso nei principali paesi a forte consumo enologico (come Francia, Italia, Portogallo, Grecia, ma anche Svizzera) si registrano consumi pro-capite di birra largamente inferiori alla media europea, mentre i più elevati consumi pro-capite di birra si registrano nell’Europa anglosassone e in quella tedesca. Spagna e Belgio riescono, invece, a conciliare buoni livelli di consumi brassicoli con buoni livelli di consumi enologici.
• Negli ultimi anni sono enormemente cresciuti i consumi di nuove categorie di bevande con gradazione alcolica simile a quella della birra: i cosiddetti “alcolici pre-mix” o “alcopop”, ottenuti dalla miscelazione di liquori e acquaviti con acque, bibite e succhi. Queste nuove bevande entrano in competizione diretta con le birre, soprattutto nella classe dei consumatori “giovani”. A loro volta molti produttori di birra hanno sviluppato nuove bevande: i cosiddetti “beer coolers” o “beer mix” ottenuti dalla combinazione di birra con bibite o succhi, con una gradazione alcolica contenuta, sostanzialmente al livello delle birre light. Inoltre molti produttori hanno lanciato “birre aromatizzate” ai liquori e alle acquaviti, in genere con gradazioni superiori alle birre normali.
La realtà italiana - Nonostante i bassi consumi pro-capite, l’Italia è, per dimensione, il quinto mercato dell’Europa Occidentale.
Secondo Assobirra nel 2004 la produzione nazionale è scesa del 3,7% (13,2 milioni di hl). Le importazioni sono ulteriormente cresciute (circa 4,9 milioni di hl) mentre l’export si è consolidato intorno a 850.000 hl. I consumi interni sono quindi valutabili in 17,2 milioni di ettolitri.
• Sia per l’evoluzione climatica negativa sia per la caduta dei consumi fuori casa, il 2004 non è stato un anno favorevole.
In questo contesto l’aver contenuto la perdita dei consumi all’1,5% rispetto al 2003 è visto come un fatto incoraggiante.
In relazione alle modalità di consumo, in ambito nazionale, va notato che i consumatori di birra “nostrani” sono in prevalenza giovani; la birra viene bevuta “fuori pasto” e in occasione di pasti irrituali e informali; quasi il 50% della birra è consumata nei quattro mesi estivi e il gusto privilegia le birre standard bionde e a bassa fermentazione (cresce però la propensione verso birre premium e specialità).
• In rapporto al totale dei consumi interni, l’Italia è il paese che ricorre maggiormente alle importazioni (ben il 28% del totale consumi). Si tenga, inoltre, conto che in Italia si producono (su licenza delle case madri) diverse importanti marche estere (Heineken, Henninger, Tuborg, Carlsberg, Bud/Budweiser, Kronenbourg, Miller ecc.) per un totale di oltre 3 mio hl.
• L’Italia, in materia di birra, è il paese più esterofilo d’Europa: oltre la metà delle importazioni proviene dalla Germania, che negli ultimi anni ha continuato a guadagnare quota sulle altre nazioni, grazie all’immagine qualitativa che questo paese ha saputo conquistare sul nostro mercato e ai notevoli sforzi di marketing da parte dei principali produttori tedeschi.
• I consumi domestici rappresentano quasi il 60% del totale quantità, mentre quelli fuori casa rappresentano il 40%. A valore, tuttavia, prevalgono i consumi extra-domestici in considerazione del fatto che nei locali di somministrazione la birra viene esitata a prezzi euro/litro molti più elevati di quelli praticati nei canali della moderna distribuzione.
• Secondo Assobirra il sistema produttivo italiano fa riferimento a otto società birrarie nazionali, che gestiscono 17 impianti produttivi, ubicati in diverse regioni del Nord e Sud Italia, che danno lavoro a 20.050 persone, tra occupati diretti e indiretti (tabella 3). Secondo le rilevazioni di Beverfood, le aziende straniere che esportano i loro prodotti sul mercato italiano sono oltre 200, nella stragrande maggioranza dei casi europee, ma con importanti marche provenienti anche dall’America Latina e dall’Est Asiatico.
• A fronte di questo notevole numero di operatori si può tuttavia rilevare un buon livello di concentrazione: i primi quattro gruppi birrai, (Heineken Italia, Peroni/Sab Miller, Carlsberg Italia e Interbrew Italia) assorbono oltre il 70% del totale mercato italiano.
Light, piatte, energy & sport drink: tutto purché… bibita
Nel mondo si consumano circa 250 miliardi di litri annui di bibite dolci rinfrescanti (lisce e gassate), pari a un pro-capite medio annuo di circa 40 litri. Le due aree continentali che esprimono i maggiori consumi pro-capite sono il Nord America (quasi 200 litri annui) e l’Europa Occidentale (106 litri annui).
Notizie dall’Europa - In accordo con le valutazioni Canadean, nei paesi dell’Europa Occidentale il consumo di bibite dolci (pronte da bere) per il 2003 ha toccato i 36 miliardi di litri (91 litri annui pro-capite). Per il 2004 le stime rilevano consumi in calo.
• Nel lungo periodo il consumo delle bevande analcoliche mostra un trend di fondo complessivamente positivo a detrimento dei consumi delle bevande alcoliche. Nel comparto delle bibite rinfrescanti, prevalgono nettamente i consumi delle “bibite dolci gassate” (oltre 29 miliardi di litri nei paesi dell’Europa Occidentale e un pro-capite medio di circa 75 litri annui).
• Tuttavia questa categoria di bevande sta ormai entrando nella fase di maturità, lasciando spazio a nuove tipologie più caratterizzate sul piano salutistico e funzionale, come le “bibite piatte” (al tè, al caffè, alla frutta ecc.) che rappresentano ormai il 14% del totale consumi delle bibite dolci e le “bevande sportive ed energetiche” che, quasi assenti fino agli anni ’90, hanno ormai raggiunto e superato il miliardo di litri consumati.
Nel comparto dominante delle bibite gassate i consumi si concentrano sulle due grandi famiglie gustative delle cole e delle aranciate, mentre l’altro terzo dei consumi è disperso su diversi gusti minori che, talvolta, nelle singole realtà nazionali possono assumere dimensioni di rilievo. All’interno del comparto bibite carbonate stanno assumendo un peso crescente le versioni light dei prodotti più diffusi, dove il normale zucchero è stato sostituito da dolcificanti di sintesi ipocalorici.
• Sullo scenario competitivo europeo emergono le tre grandi multinazionali del beverage analcolico: Coca Cola, Pepsico e Cadbury-Schweppes. I tre gruppi sono presenti direttamente o indirettamente in quasi tutti i mercati europei, quasi sempre in posizione di leadership e controllano all’incirca i due terzi del totale volumi di bibite dolci. Ad essi si affiancano numerosi produttori nazionali, talvolta operanti in joint venture con le stesse multinazionali.
La realtà italiana - l’Italia rappresenta il quinto mercato in Europa Occidentale dopo Germania, Gran Bretagna, Spagna e Francia, con un volume complessivo di consumi (bibite gassate, tè freddi, sport & energy drink e preparati) stimato per il 2003 intorno ai 3,9 miliardi di litri.
• Se rispetto al 2002 si è registrato un incremento del 7%, il 2004 testimonia di un arretramento dei consumi intorno al 2-3% per le bibite carbonate e intorno al 7-8% per il tè freddo e gli sport drink.
Gli energy drink risultano invece in crescita (rappresentano in volume tuttavia solo l’1% del totale consumi di bibite dolci).
• Il consumo pro capite italiano è intorno ai 66 litri annui complessivi, largamente inferiore alla media europea.
• Le bibite gassate (con un consumo complessivo di 3 miliardi di litri e un pro-capite di 52 litri) prevalgono sul resto; in auge le “cole”, cui seguono aranciate, lime e bibite al limone. È comunque in atto uno spostamento dei consumi dalle bibite zuccherate a quelle senza zucchero.
• Grande successo ha avuto il “tè freddo” (normale, aromatizzato alla frutta, tè verde, comprese le versioni light e deteinato), i cui consumi sono stimabili complessivamente intorno ai 600 milioni di litri (10 litri pro capite). Sul mercato nazionale cominciano a essere diffuse anche nuove tipologie di bibite piatte: “bevande proteiche” (alla soia, al riso o ai cereali) e le “tisane pronte”, con uno spiccato valore salutistico, ma che rappresentano al momento solo una nicchia di consumo.
• Ottimo sviluppo anche per le “bevande sportive” (85 milioni di litri), mentre più difficoltosa è stata l’affermazione degli “energy drinks (25 milioni di litri).
• Il settore delle bibite si è distinto nel tempo per il deciso tasso di innovazione sul piano dei prodotti, ma anche sul piano delle confezioni e dei formati, che hanno assunto un peso crescente nel marketing mix delle imprese.
•Le bottiglie di vetro valgono oggi circa l’8% dei volumi nel comparto delle bibite gassate (con un utilizzo prevalente nei canali dell’Horeca), mentre nei comparti delle bibite piatte e degli sport & energy drink il peso delle bottiglie in vetro è del tutto marginale.
• Dominano, invece, con oltre due terzi del mercato, le bottiglie in PET nei grandi formati da 1 e 1,5 litri per il consumo familiare; stanno crescendo in modo notevole i formati single serve. In quest’ambito stanno trovando crescente affermazione le c.d “Sport Bottle” con il pratico sistema di erogazione “pull & push”.
• Il cartone politenato ha una quota significativa (10%) solo nel segmento del tè freddo, mentre le lattine giocano un ruolo dominante nel segmento degli energy drink, rappresentano una quota importante (14%) nelle vendite di bibite carbonate, ma solo il 5% nel comparto delle bibite piatte. Per le bibite piatte, infine, assumono un grande rilievo i bicchierini in plastica (tipici del tè freddo), mentre cominciano a essere utilizzate le originali buste in materiale flessibile (cheerpack).
• I consumi domestici fanno riferimento anzitutto al dettaglio moderno (iper, super, discount) che assorbe circa il 55% del totale vendite, mentre il dettaglio tradizionale è minoritario (10%) e comunque in fase decrescente. I consumi fuori casa valgono circa un quarto del totale volumi (Horeca, catering collettivo, chioschi e punti di vendita mobili, vending). Nei locali horeca è diffusa la pratica del dispensing (circa 1/4 del totale volumi realizzati in questo canale) con il prodotto sfuso servito alla spina.
• Secondo le valutazioni Beverfood, in Italia le prime quattro posizioni del settore delle bibite dolci sono occupate da Coca Cola, Sanpellegrino/Nestlè, San Benedetto/Schweppes e Pepsico Italia (3/4 del totale volumi prodotti nel settore). I secondi quattro del mercato (Spumador, Campari, Ferrero, Sangemini) assorbono un altro 15% del totale produzione, mentre poco più del 10% è suddiviso fra un centinaio di altri produttori, di cui molti a carattere locale (tabella 4).
Succhi e nettari: cresce il consumo dei prodotti “nobili”
Le bevande ad alto contenuto di frutta rappresentano la parte più nobile del beverage analcolico e, in quanto tale, hanno livelli di consumo più bassi rispetto a bibite e acque confezionate. La stima del consumo mondiale si aggira intorno ai 40 miliardi di litri (un pro-capite annuo compreso tra i 6 e i 7 litri). Nord America ed Europa ne assorbono i 2/3 del totale.
Notizie dall’Europa - Circa 10 miliardi di litri di succhi e nettari (pro-capite circa 25 litri annui) consumati in Europa Occidentale nel 2003. Accanto a questi, anche altre bevande piatte a minor contenuto di frutta, i juice drinks, di cui sono stati consumati 3 miliardi di litri (7-8 litri pro-capite all’anno).
• Anche se la tendenza dei consumi è moderatamente positiva, con il consolidamento dei volumi dei tradizionali succhi e nettari e una crescita più decisa delle nuove bevande fruttuose a maggior contenuto salutistico, nel 2004 c’è stato qualche segno di cedimento; la Germania (piazza europea più importante) ha perso circa il 4% dei volumi.
• La categoria merceologica più diffusa nei principali mercati europei è quella dei succhi interi a temperatura ambiente (UHT) e tuttavia i nettari mostrano una migliore dinamica di crescita, soprattutto le più moderne versioni arricchite e integrate con vitamine, sali e fibre. I succhi freschi e le spremute industriali hanno avuto un buon successo in alcuni mercati nazionali (Gran Bretagna, Francia) mentre non sono riusciti a decollare in altri mercati (Germania, Italia).
• Il quadro competitivo, contrariamente a quanto accade nel settore delle bibite, appare più frastagliato con il dominio dei produttori nazionali. I gruppi che stanno puntando con decisione ad un’articolazione multinazionale sono: il gruppo tedesco Eckes Granini, il gruppo anglo/tedesco Gerber-Emig, il gruppo italiano Conserve Italia e i gruppi austriaci Rauch, Pago e Pfanner, cui si sono recentemente aggiunti le grandi multinazionali americane dei soft drinks Coca Cola e Pepsico, che operano nel settore rispettivamente con i marchi Minute Maid e Tropicana.
La realtà italiana - Nel 2003 il mercato italiano delle bevande piatte a base frutta ha registrato un volume complessivo di circa 930 milioni di litri (+10% rispetto al 2002). Nel 2004 si stima, invece, un volume complessivo di circa 870 milioni di litri (-6% in volume) con consumi pro-capite intorno ai 16 litri per il totale comparto e intorno ai 14-15 litri se si fa riferimento ai soli succhi e nettari (ancora sensibilmente inferiori ai valori di altri Paesi europei). Le ragioni sono da addebitarsi a nostre abitudini alimentari: elevata disponibilità di frutta fresca, esclusione dei succhi di frutta dai pasti principali e scarso utilizzo nella prima colazione.
• Sul mercato italiano i succhi al 100% rappresentano solo il 15% del totale mercato delle bevande fruttuose, mentre i chilled juices, ben accolti altrove, coprono solo il 2% del totale. Il mercato è dominato dai nettari (30% di frutta, acqua e zucchero), nel cui ambito riconosciamo i polposi (che contengono anche purea di frutta) e i più recenti nettari limpidi, spesso presentati in mix di diverso gusto e in versione arricchita (con vitamine, sali, fibre). Queste ultime tipologie di prodotto rappresentano la parte più innovativa e dinamica del mercato, che ha contribuito alla crescita dei consumi in questi ultimi anni, grazie a un’immagine salutistica e alla più larga disponibilità gustativa. Il 9% dei consumi interessa infine, le bevande piatte a più ridotto contenuto di frutta (meno del 30%), alternativa naturale ai classici soft drink gassati.
• Lo sviluppo del mercato è stato favorito oltre che dall’innovazione di prodotto anche da una forte innovazione di packaging: lancio di nuovi tipi di confezioni (bottiglie di PET protetto, cheer pack), costante miglioramento dei contenitori di cartone politenato e delle bottiglie di vetro, sia nella forma che nelle chiusure. In tal modo è stato anche possibile migliorare il processo di segmentazione, creando confezioni su misura per i vari canali di vendita, le diverse occasioni di consumo e i diversi target di consumatori.
• Il contenitore di cartone politenato rimane il tipo più utilizzato (70%) con la crescente e sorprendente affermazione dei formati da 2 litri e da 1,5 litri, che hanno ingenerato una forte competizione nei prezzi. Al secondo, posto si collocano le nuove bottiglie di PET, mentre le bottiglie di vetro rappresentano l’11% dei volumi, in gran parte veicolate nei locali dell’Horeca. Il rimanente viene confezionato in cheer pack, lattine e bicchierini monodose.
• La commercializzazione avviene per circa 2/3 attraverso la tipologia distributiva del “libero servizio”, per il 15% attraverso il dettaglio tradizionale, per il 16% attraverso il canale Horeca e per il 2% con il settore della distribuzione automatica.
• Sul mercato italiano delle bevande alla frutta operano, secondo le rilevazioni Beverfood, circa 50 società, di cui 30 rappresentano delle unità di produzione nazionale e un’altra ventina è costituita da società commerciali che distribuiscono soprattutto marchi importati dall’estero (tabella 5). Oltre il 60% del mercato italiano di succhi, nettari e bevande a base di frutta è controllato da quattro aziende.
• Leader consolidato è Conserve Italia (marchi Valfrutta, Derby e Yoga, oltre a produzione private label per la GDO). Segue il gruppo La Doria, che ha assorbito la Confruit, portandosi, in tal modo al 12% del totale mercato. Segue il gruppo Parmalat (linea Santal); le vicende finanziarie del gruppo parmense non hanno affievolito la capacità produttiva e commerciale dell’azienda, che sta ora rilanciando nel comparto salutistico con la nuova linea di bevande e prodotti funzionali a marchio Jeunesse. Al quarto posto si colloca il gruppo Zuegg, specializzato nella lavorazione della frutta (confetture, semilavorati e succhi e bevande frutta).
• Sta crescendo fortemente la Rauch austriaca, che ha sfondato nella GDO con i brik da due litri e sulla stessa scia si sta ponendo anche Pfanner, mentre il terzo produttore austriaco (Pago) ha un approccio da marca premium, diventando leader nel canale bar. Del Monte Italia ha avuto delle difficoltà a seguito delle vicende del gruppo Cirio cui apparteneva, ma adesso ha ripreso in pieno la sua attività produttiva e distributiva, caratterizzandosi soprattutto sui prodotti esotici. Nel mercato è entrato da diverso tempo anche il gruppo Coca Cola con il marchio Minute Maid, ma finora non è riuscito a conquistare spazi di rilievo.
Vino: annate scarse, ma l’export regge
Secondo i dati ufficiali 2005 espressi da Assoenologi (l’Associazione enologi enotecnici italiani li ha presentati alla XVI edizione del Seminario Renato Ratti, organizzato in collaborazione con Ice e Veronafiere-Vinitaly), nei primi sei mesi del 2005 l’export italiano di vino è aumentato dell’8,3% in volume e dell’1,4% in valore.
C’è da registrare, invece, il rallentamento della produzione vitivinicola, che nel 2005 ha registrato infatti un calo dell’11%.
I dati parlano di 47,5 milioni di hl prodotti contro i 53,3 milioni dello scorso anno, ma il decremento non raggiunge i livelli scarsissimi del 2002 e del 2003. Sotto il profilo qualitativo, gli enologi richiamano l’attenzione anche su una certa eterogeneità, dove alle punte di eccellenza fanno da contraltare momenti di mediocrità.
• Quanto alle esportazioni, nei primi sei mesi del 2005 sono aumentate dell’8,3% in volume e dell’1,4% in valore, con buone performance in UK (+16,6% in valore), Danimarca (+7,6%), Repubblica Ceca (+96%) e Svizzera (+13%). Scende invece la Germania del 2% in valore, ma cresce del 9% in volume.
Il mercato statunitense, con il 27% dell’export, rappresenta il principale canale di sbocco per i vini italiani.
(Fonte Associazione Enologi Enotecnici Italiani)
|
|
Focus on water, beer, beverages, juices and wine
The consumption figures shown here are taken from the information divulged by the trade associations, processings by Beverfood and from syntheses by Simei and Vinitaly Communication Offices.
Mineral water production: Italy at the top
The world production and the consumption of packed water stands, with reference to 2003, at around 140 billion litres a year, standing at a per capita consumption of around 23 litres a year. In the field of “cold soft drinks” packaged water registers the highest rates of expansion (9% a year). The two continental areas with the greatest per capita consumption are western Europe and North America, that all told, while representing only 11% of the world population, absorb about half of the world consumption of packed water.
News from Europe - According to Canadean and EFBW (European Association of Producers) ratings, in 2003 consumption of packed water in the countries of western Europe can be estimated as standing at around 42 billion litres, with per capita consumption of 106 litres a year. The European continent is rich in natural springs and hence, nearly all the consumption of bottled water is satisfied by natural waters (mineral and spring water), while in the rest of the world treated waters prevail (purified and also refined).
• In nearly all the European countries the consumption of still water prevails, apart from in the markets of the countries where German is spoken (Germany, Austria and Switzerland) where the consumption of carbonated waters prevail but where all the same the consumption of still water is growing more rapidly.
• The climatic factor has a decisive influence on the levels of consumption, even if some “cold” countries (Belgium Germany and Switzerland) are strong consumers of mineral waters. Indeed, the tradition of the spas culturally laid way for the development of the consumption of mineral waters.
• The boom of the market was undoubtedly favored by the policies of low prices; in the countries with low per capita consumption in turn an elitist conception of the market has been favored, with the offer of mineral waters placed as premium beverage, at times even above that of carbonated soft drinks.
The situation in Italy - With 12 billion litres produced in 2003 and over 11 billion consumed in the same year, the Italian market holds the record in Europe. In Italy, packaged drinking water is virtually all mineral water, thanks to a wealth of natural sources. And even if the summer of 2004 didn’t feature the “thermal bubble” of the year previous and consumption settled around normal figures, these still show growth compared to 2002.
• The growthrates of the Italian market appear lower than the European average, in consideration of the high consumption. In the five years it would be reasonable to expect an average growth contained around 2% a year.
• The consumption per capita of mineral water is 180 litres a year, that goes up to 183 litres if one also includes spring water. The per capita consumption figures are the highest in the world. The figures are higher in northern Italy, while in the South and in the Islands per capita consumption is below average, but shows growth potential.
• The turnover of Italian mineral water producers can be estimated at around 2,100 million Euros (referring to 2004), while the figures for consumption (expenditure of Italians) can be rated in at least 3,000 million Euros. Relating the figures in terms of value to the quantity figures one can see that the average prices (prices at production and consumption) are very low, probably the lowest in Europe. This policy of low prices has certainly increased consumption in Italy, all the same it poses problems of profitability.
• Packaging innovation has also played a propulsive role in this field. Over the years the “weight” of the glass bottle has dropped considerable (21% of total volume) that today are almost exclusively only present in the Horeca and “door to door” channels, where the “returnable empty” still holds sway.
• As far as plastic containers are concerned (79% of total volume), the PET bottles by now have the lion’s share, while the bottles in PVC are no longer in circulation. The 1.5 and 2 litre PET bottles are the most sold for family consumption.
• The single serve PET 0.5 litre bottle, has by now become an almost exclusive form for some channels (fast food, vending, food kiosks, etc.) and is contributing decisively to the current growth of consumption outside the home.
Lesser forms (0.25 and 0.33 litres) are more specifically destined to Horeca locations, with the intent of surplanting the old and questionable practise of serving mineral water in a glass.
• The breakdown of Italian mineral water consumption can be estimated as follows: 76% in the domestic field (8 billion litres attributable to broadscale distribution salespoints) and 24% away from the home (2.5 billion litres administered through, Horeca, collective catering and vending…).
• The domestic consumption of mineral water is also encouraged by the numerous traditional food salespoints and by the “door to door” system of sales. Price competition is particularly stressed, where a true and proper structuring of the offer in different prices ranges features, that though are systematically remixed by the resorting to promotional offers.
• According to Mineracqua ratings, the production system of water packed in Italy is structured as follows:
- 170 active sources;
- around 300 brands of packaged water;
- 7,500 direct employees;
- 32,500 indirect employees.
• The degree of concentration of the market is fairly high but less accentuated compared to the beverage market (table 2). According to Beverfood ratings the first 4 productive groups Nestlè/Sanpellegrino, San Benedetto, Congedi/Uliveto/Rocchetta and Ferrarelle) absorb around 58% of the total quantity market. The first 10 groups (the four preceding ones plus Spumador, Norda, Sant’Anna, Sangemini, Lete/Prata e Gaudianello) account for close on ’80% of the total market (table 2) The leading producers are having a hard time in keeping their shares of the market, being hard pressed by a sizeable group of very combative medium-sized concerns, that after having gained leadership positions at regional level, are trying to attain national distribution.
(fonte: Beverfood)
Beer: Europe and North America down, Asia and East Europe up
The competitive picture in the world features an intense process of concentration. In these last years beer production and consumption has grown at rates of around 2-3% a year.
The continental record goes to Oceania (86 litres) that all the same, considering its number of inhabitants (only 25 million) only accounts for a modest part on the international scene. Asia, with around 60% of the world population is at a mere 11 litres of per capita consumption, represents the most promising continent in terms of prospective development, while Africa for the moment stays in a marginal position (4.5% of the world total).
The first 10 producing countries absorb over two thirds of world beer production. China having just installed itself at the head of this rating with an output of 254 million hls, having finally outstripped the USA (232 million hls).
News from Europe - The European groups Heineken and Carlsberg are at fourth and fifth place in the world rating of producers.
• According to Brewers of Europe ratings, in 2003 western Europe produced 319 hls of beer, consumption being slightly less (298 million hls), seen by the fact that the balance of trade shows a surplus of 20 million hls. The sector is considered on the point of being fully mature, with consumption falling off slowly, while output volumes are being kept up thanks to exports.
• 2004 registered a further loss in consumption of 1.5% in volume. Per capita consumption is estimated at around 75 litres a year; ten years ago it was over 80 litres. Compared to other cold drinking categories, beer is in third place in the European consumption ratings, behind packed water and soft drinks (still+carbonated).
• Beer consumption has to aboveall compete with other alcoholic beverages, wine first and foremost; not by chance the strong wine consuming countries (ie France, Italy, Portugal, Greece but also Switzerland) have average beer consumption rates a lot lower than the European average, while the UK and Ireland as well as Germany feature as the highest beer consuming countries in Europe. Spain and Belgium though manage to combine good beer consumption with good wine consumption levels.
• The last few years has seen the growth of the consumption of new beverage categories with alcohol levels similar to those of beer: the socalled “alcoholic pre-mixes” or “alcoholpops”, obtained by mixing spirits with water, soft drinks and juices. These new beverages enter into direct competition with beer, aboveall in the “young” consumer class. In turn many beer producers have developed new drinks: the socalled “beer coolers” or “beer mixes” obtained by mixing beer with soft drinks or juices, with a low alcohol content, generally at that of light beer. Many producers have also launched beer aromatised with spirits, in general with an alcohol content higher than that of normal beers.
The Italian situation - Despite its low per capita consumption, Italy, due to its size, is the fifth market in western Europe. According to Assobirra in 2004 Italian beer production dropped by 3.7% (13.2 million hls). Imports have grown even further (around 4,9 million hls) while exports have consolidated at around 850,000 hls. Italian domestic consumption can be calculated at 17,2 million hls.
• Due both to bad weather as well as to the drop in consumption away from home, 2004 was not a good year for beer consumption in Italy. In this context, having limited losses in consumption to 1.5% compared to 2003 is seen to be encouraging.
In terms of modes of consumption, Italian beer consumers are mainly young; the beer is drunk outside regular mealtimes and at non ritual, informal meals; virtually 50% of beer is consumed in the four summer months with a preference for standard, low fermentation lager-type beer (though the taste for premium and special beers is growing).
• In relation to total domestic consumption, Italy is the country that resorts most to imports (as much as 28% of total consumption). It should also be considered that, under license of the parent company, in Italy various important foreign brands (Heineken, Henninger, Tuborg, Carlsberg, Bud/Budweiser, Kronenbourg, Miller ecc.) produce a total of over 3 million hls.
• Italy shows the greatest preference for foreign beers among European nations: over half of imports are from Germany, who over these last years has continued to increase its share at the expense of the other nations, thanks to a quality image that Germany has been able to build up on the Italian market and to the considerable efforts in marketing made by the main German producers.
• Consumption in the home accounts for virtually 60% of the total quantity, while 40% is away from home. In terms of value, away from home consumption predominates in consideration of the fact that in the businesses where beer is administered the cost per litre is much higher than that applied in modern distribution channels. • According to Assobirra the Italian production system centres on eight Italian breweries, that run 17 production plants, situated in various regions in North and South Italy, that account for direct and indirect employment of 20,050 people. According to Beverfood studies, some 200 foreign concerns export their product to the Italian market (table 3). These are virtually all European, though including important brands from Latin America and East Asia.
• All the same this considerable number of operators features a high level of concentration: the first four breweries (Heineken Italia, Peroni/Sab Miller, Carlsberg Italia and Interbrew Italia) absorb over 70% of the Italian market.
(Source: Beverfood)
Light, flat, energy & sports drinks: anything goes…to make a drink
In the world 250 billion litres of sweet refreshing beverages (still or carbonated) are consumed each year, standing at an average annual per capita figure of around 40 litres. The two continental areas with the greatest per capita consumption are North America (almost 200 litres a year) and western Europe (106 litres a year).
News from Europe - Confirming Canadean figures, in western European countries sweet beverage (ready to drink) consumption for 2003 touched 36 billion litres (91 litres a year per capita). For 2004 estimates show consumption dropping.
• In the long run the consumption of non alcoholic beverages shows an overall longterm positive trend to the detriment of alcoholic beverages. In the refreshing soft drinks segment, “sweet carbonated soft drinks” consumption prevails (over 29 billion litres in western European countries and a per capita average of around 75 litres a year).
• All the same this beverage category can almost be considered mature, leaving space for new kinds of beverages with stronger health and functional features, such as “flat drinks” (based on tea, coffee and fruit etc.) that now account for 14% of total consumption of sweet soft drinks and the “sports and energy drinks”, that, virtually absent up to the nineties, have now gone beyond a billion litres consumed.
In the segment dominated by carbonated beverages, consumption is concentrated on two large flavour families of colas and oranges, while the other third of consumption is spread over minor flavours that, at times in the single national situations can take on a given size. Inside the carbonated beverages the “light” versions of the most popular products are gaining ground, where the normal sugar has been replaced by low calorie sweeteners.
• The European competitive scenario is dominated by three huge non alcoholic beverage multinationals: Coca Cola, Pepsico and Cadbury-Schweppes. The three groups are directly or indirectly present on nearly all the European markets, nearly always in a position of leadership and control around two thirds of the total volumes of sweet soft drinks. Numerous national producers also feature, at times operating under joint venture with the same multinationals.
The Italian situation - Italy accounts for a fifth of the western European market after Germany, UK, Spain and France, with an overall volume of consumption (carbonated beverages, cold teas, sports & energy drinks and preparations) estimated for 2003 at around 3.9 billion litres.
• Compared to 2002 an increase of 7% was registered, while 2004 shows a drop in consumption of around 2-3% for carbonated beverages and around 7-8% for cold tea and sports drinks.
Energy drinks though are showing growth (though in volume they only account for 1% of the total consumption of sweet beverages).
• Italian per capita consumption is around 66 litres per year overall, considerably below the European average.
• Carbonated beverages (overall consumption of 3 billion litres and a per capita consumption of 52 litres) prevail; colas feature first, followed by orangeade, lime and lemonade. There is however a shift of consumption from sugared to sugar-free soft drinks.
• Cold tea has enjoyed a great success (normally aromatised with fruit, green tea, including the light and detanninated versions), the consumption of which can be estimated as standing at an overall 600 million litres (10 litres per capita). New types of flat beverages are spreading on the Italian market: “proteic drinks” (soya, rice or cereal based) and “ready herb teas”, with a high health value, but that at the moment only constitute a consumer niche.
• Sports drinks have also shown excellent growth (85 million litres), while energy drinks have had a harder time in being accepted (25 million litres).
• The soft drinks sector features strong product innovation, but also innovation in terms of packs and formats, that have taken on growing weight in the company marketing mix.
• Glass bottles today account for 8% of the volumes in the carbonated beverage segment (mainly used in the Horeca channels), while the flat and sports & energy drinks segment the use of glass is merely marginal.
• The PET bottles in the large 1 and 1.5 litres family formats dominate with over two thirds of the market; the single service formats are growing considerably. In this field the c.d “Sport Bottles” are enjoying ever greater popularity with the practical “pull & push” dispensing system.
• Polythenated board only has an important share (10%) in the cold tea segment, while cans play a dominant role in the energy drink segment, accounting for an important share (14%) of the sale of carbonated drinks, but only 5% in the flat drinks segment. Lastly, as regards flat drinks, plastic beakers show considerable importance (typical to cold tea), while the original flexible Cheerpack bags are beginning to be used.
• Consumption in the home is aboveall ruled by modern retail (hypermarkets, supermarkets, discounts) that absorb around 55% pf sales, while traditional retail only accounts for 10% , a share that is dwindling. Consumption away from the home accounts for nearly a quarter of total volumes (Horeca, collective catering, kiosks and mobile salespoints, vending). Dispensing is common in Horeca businesses (around 1/4 of total volumes made in this channel) with the loose product served on tap.
• According to Beverfood ratings, in Italy the first four positions in the sweet beverage sector are taken up by Coca Cola, Sanpellegrino/Nestlè, San Benedetto/Schweppes and Pepsico Italia (3/4 of total volumes produced in the sector). The second market foursome (Spumador, Campari, Ferrero, Sangemini) absorb another 15% of total output, while a little more than 10% is shared out between a hundred-or-so other producers, many of which local (table 4).
Juices and nectars: the consumption of “noble” products is growing
The high fruit content beverages represent the noblest part of non alcoholic beverages and, inasmuch as such, they have levels of consumption that are lower compared to soft drinks and packed water. World consumption is estimated at around 40 billion litres (a per capita annual consumption of between 6 and 7 litres). North America and Europe absorb 2/3 of the total.
News from Europe - Around 10 billion litres of juices and nectars (25 litres a year per capita) were consumed in western Europe in 2003. To these one should add 3 billion litres (7-8 a year per capita) of other still “juice drink” beverages with a lesser fruit content.
• Even if consumption trends are moderately up, with the consolidation of the volumes of the traditional juices and nectars and a more decided growth of the new fruity beverages that have a higher health content, 2004 showed some signs of a weakening; Germany (the most important European market) was down 4% in volumes.
• The most widespread category on the main European markets is that of room temperature (UHT) whole juices, all the same the nectars show a better growthtrend, aboveall in the more enriched vitamin, salt and fibre integrated modern versions. The fresh juices and the industrial squashes have enjoyed a great success on some national markets (UK, France) while they have not managed to take off in other markets (Germany, Italy).
• The overall picture, against what is happening in the soft drinks sector, is more patchy with the national producers holding sway. The groups that are decidedly aiming at a multinational approach are: the German group Eckes Granini, the Anglo/German group Gerber-Emig, the Conserve Italia and the Austrian groups Rauch, Pago and Pfanner, that have now been joined by the huge US soft drinks multinationals Coca Cola and Pepsico, that operate in the sector respectively with the brands Minute Maid and Tropicana.
The situation in Italy - In 2003 the Italian still beverage fruit based market registered an overall volume of around 930 million litres (+10% compared to 2002). 2004 in turn shows an overall volume of around 870 million litres (-6% in volume) with per-capita consumption around 16 litres for the entire segment and around 14-15 litres if one only refers to juices and nectars (still well below the figures for other European countries). The reasons are to be put down to Italian food habits: high availability of fresh fruit, exclusion of fruit juices from the main meals and limited breakfastime consumption.
• On the Italian market the 100% juices account for a mere 15% of the fruit beverage market, while the chilled juices, a success elsewhere, only cover 2% of the total. The market is dominated by nectars (30% fruit, water and sugar), divided up into pulp products (that contain fruit puree) and the more recent clear nectars, often presented in a mix of different flavours and enriched (with vitamins, salts, fibres).
The latter type of product features as the most innovatory and dynamic part of the market, that has contributed to the growth in consumption over these last years, thanks to its health-giving image and the broader range of flavours. Lastly, still beverages with an even more reduced fruit content (less than 30%) account for 9% of share, natural alternative to the classical carbonated soft drinks.
• As well as by product innovation market growth has been engendered by strong packaging innovation: launches of new types of packs (protected PET bottles, cheerpacks), constant improvement of the polythenated cardboard containers and glass bottles, both in shape and in closure. This has also allowed the improvement of the segmentation process, creating made-to-measure packs for various sales channels, the different occasions for consumption and the different consumer targets.
• The polythenated cardboard container is still the most used type (70%) with the growing and surprising success of the 2 litre and 1.5 litre formats that have generated a strong price competition. In second place we have the new PET bottles, while glass bottles account for 11% of volumes, largely vehicled by Horeca businesses. The remainder is packed in cheerpacks, cans and single dose beakers.
• Marketing is 2/3 by way of the “free service” distribution, 15% through traditional retail, 16% through Horeca and 2% vending.
• According to Beverfood studies, around 50 concerns operate on the Italian fruit beverage market, 30 of which represented by national production units and another twenty or so constituted by trading companies that aboveall distribute brands from abroad (table 5).
Over 60% of the Italian fruit based juice, nectar and beverage market is controlled by four concerns.
• The consolidated leader is Conserve Italia (Valfrutta, Derby and Yoga, as well as private label production for broadscale distribution). This is followed by La Doria, that has absorbed Confruit, bringing its share to 12% of the market total. This is in turn followed by the Parmalat (Santal line) group; the financial troubles of the Parma group have not weakened its production and marketing capacity, that is now relaunching in the health and fitness segment with the new line of functional beverage products under the Jeunesse brand. In fourth place one has the Zuegg group, specialised in fruit processing (jam, semiprocessed items and fruit juices, beverages). • Rauch of Austria is growing fast, that has broken through in broadscale distribution with the two litre brik and Pfanner is right behind it, while the third Austrian producer (Pago) has a premium brand approach, having become leader in the bar channels. Del Monte Italia has also had difficulty following the matters involving the Cirio group to which it belonged, but has now resumed its production and distribution activity to the full, aboveall featuring exotic products. For some time now the Coca Cola group has been on the market with the Minute Maid brand, but up till now it has not been able to carve out any sizeable space for itself.
Wine: poor harvest but exports are holding their own
According to official data expressed by Assoenologi (the Italian winemaker and wine technologist’s association presented at the XVI edition of Renato Ratti Seminar, organized in cooperation with Ice and Veronafiere-Vinitaly), in the first six months of 2005 Italian wine exports increased 8.3% in volume and 1.4% in value.
Though wine production has slowed, 2005 in fact registering a drop of 11%. Figures speak of 47.5 million hectolitres produced against 53.3 million of last year, but the slide has not reached the poor levels of 2002 and 2003. On the quality side of things, winemakers also show mixed results, where peaks of excellence are countered by mediocre production.
• As far as exports are concerned, in the first six months of 2005 they increased 8.3% in volume and 1.4% in value, with good performance in the UK (+16.6% in value), Denmark (+7.6%), Czech Republic (+96%) and Switzerland (+13%). Germany on the other hand is down 2% in value but up 9% in volume. The US market, with 27% of exports, stands as the main outlet channel for Italian wines.
(Source: Italian Winemakers and Wine technicians’ association). |
|
|
|